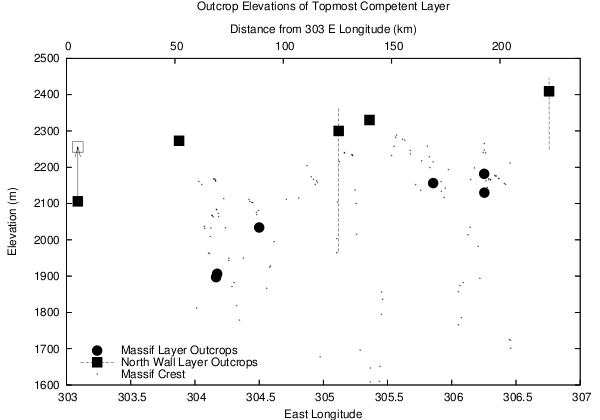
Figure 11: East longitude of the topmost strong layer outcrop locations and their elevations both in the massif and in the north rim of eastern Coprates Chasma are shown. The elevations of the crest of the massif are also plotted to show the variability of the massif crest in relation to the layer outcrops. The westernmost north rim data point has an arrow which points to the estimated elevation of the layer in this location prior to the 150 m down-dropping of this portion of the plateau (see Sections 3.4 and 4.1 for details). The error bars on the other two data points result from imperfect pointing information which prevents accurate MOC/MOLA alignment for these outcrops.
Return to Layering stratigraphy of eastern Coprates and northern Capri Chasmata, Mars.
A version of this figure was published by Elsevier Inc. Copyright © 2005 Ross A. Beyer.